How to compute descriptive statistic covariance in ubuntu linux using Gnumeric spreadsheet covariance tool
What is Covariance
Covariance is a term from statistics and probability theory; it is a measurement of joint variability between two random variables. You can calculate the covariance between two random datasets using the following formula mentioned in the image below: If you want to calculate covariance, then you need to follow the following steps:- Calculate the mathematical mean between variables
- Find the deviations from the mean for each data point
- Multiply the deviations of variables>
- Calculate the sum of all multiplications
About Gnumeric:
Gnumeric is a freely available tool in the GNOME software foundation. It is the best open-source spreadsheet processing tool with a GNU GPL license. It can work like a Microsoft Excel tool.In Gnumeric, we can apply various mathematical operations to spreadsheets. While working with the Gnumeric application, I noticed that we can also process statistical correlation and covariance operations on the spreadsheet data by following simple steps without writing any complex formulas to handle the spreadsheet data. Here we must create the datasets to work with in the Gnumeric spreadsheet.
How to install Gnumeric on Linux:
You need to open the Terminal and use following commands:sudo apt-get update
sudo apt-get install gnumeric
About the Gnumeric Covariance Tool:
Gnumeric Covariance tools support computation of the pairwise covariance coefficients on the input data variables. This tool has the ability to generate n numbers of the coefficient calculations. To calculate covariance, follow the belowmentioned steps.Steps to calculate pairwise covariance coefficients on the input data in Gnumeric spreadsheet:
- Open Gnumeric using Application from office applications
- Prepare dataset in Gnumeric spreadsheet
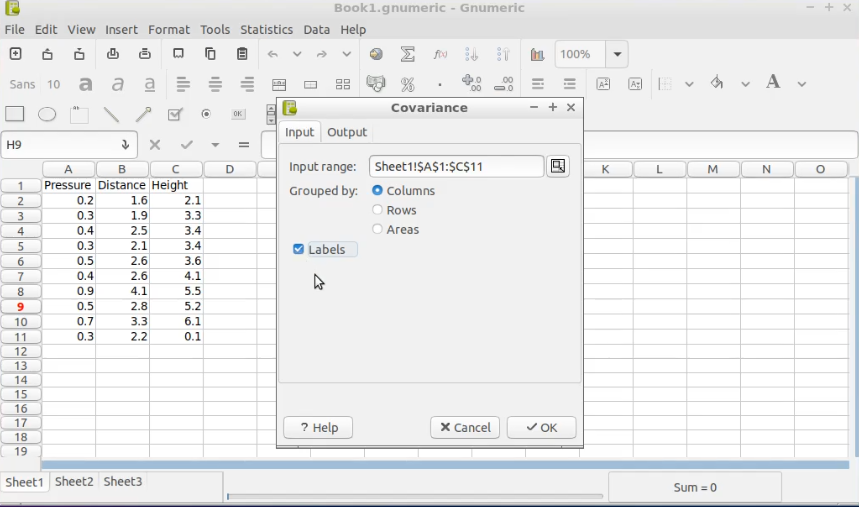
- select the correlation operation from the toolbar menu From the taskbar, select the correlation operation from the toolbar menu. Navigate to "Statistics-> Descriptive Statistics -> Covariance." Select your input data range (select columns with values for covariance as input).
- Select your Output display format from Covariance output dialog New Sheet : To create result on new sheet
- Click on Ok to generate the covariance result; this will create a new sheet with the name covariance of the covariance result for the selected data inputs. Output result sheet
Note: The first row indicates the labels for the dataset, and other values are inputs. Covariance tool operation window Select input data range with label
New WorkBook : To display result on new gnumeric workbook sheet
Output range : To display result on exiting data sheet on provided cells range
Application Areas of Covariance:
- Finance and Investment
- Data Science and Machine Learning
- Economics
- Engineering
- Physics
- Biostatistics and Genetics
- Econometrics and Business Analytics
- Artificial Intelligence and Robotics
- Social Sciences
- Meteorology and Climate Science
The intended audience for correlation usage
The intended audience for correlation usage is broad and spans across multiple disciplines.- Business and Finance Professionals
- Scientists and Researchers
- Engineers and Technologists
- Educators and Students
- Health and Life Sciences Professionals
- Economists and Policymakers
- Artificial Intelligence and Robotics Experts
- Marketing and Advertising Specialists
- Legal and Forensic Experts


Comments
Post a Comment
Thanks for your valuable input